This flag indicates whether the differences in the results in this matrix are statistically
significant according to a chi-square test. The distribution of observed frequencies is compared
to expected frequencies from a distribution where there is no relationship between the two axes.
If the total difference is greater than the chi-square statistic for the 95% confidence level,
then the results are considered statistically significant.
Welcome!
Please take a moment to read these useful tips.
1/4
Select a question to visualize survey results. Use ‘+’ signs to compare answers to multiple questions.
2/4
Use these buttons to toggle between different views for the selected question(s).
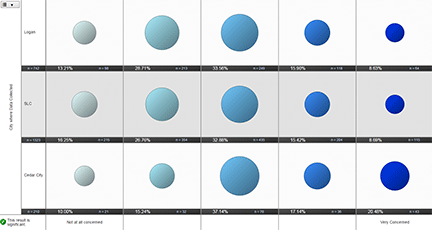
Percentage View: Shows the number and percentage of respondents. Can be disaggregated by
characteristics of respondents.
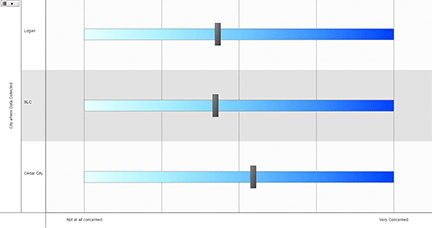
Mean View: Shows the mean or average response for all respondents. Can be disaggregated
by characteristics of respondents.
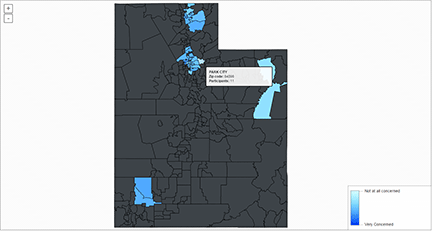
Heat Map View: Shows the mean or average response organized by the zip code of
respondents.
3/4
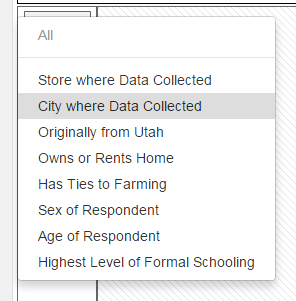
Choose between predefined demographic categories to disaggregate data among groups of respondents.
4/4
For selected questions that show the percentage of respondents across categories, a flag is displayed here that indicates if differences across groups are statistically significant.
Utah's Water Future - Household Survey - Water Use