GAMUT Sensor Data Workflow
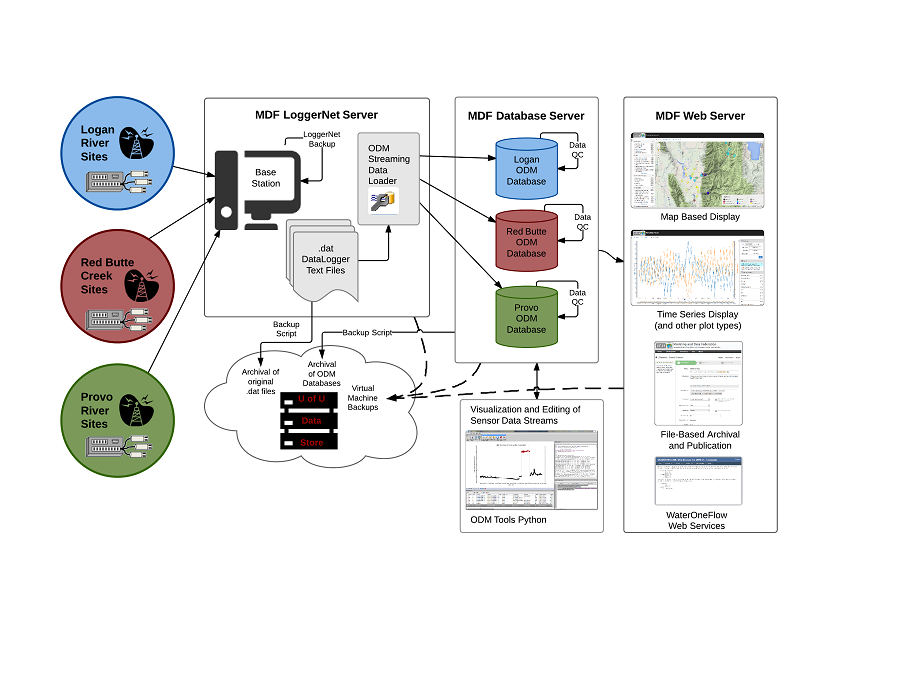
This is a workflow illustrating the steps in the flow of GAMUT data and the CI tools deployed to support it. The workflow ensures that data are continuously ingested with essential metadata. It also addresses the challenges related to tracking physical infrastructure, managing data streaming from multiple watersheds, and data quality assurance and quality control (QA/QC). A detailed description of the workflow can be found here.
1. Monitoring Site Design and Communications
The suite of sensors at each site are connected to a datalogger, which provides programming logic to operate the site and onsite data storage. A single connected server enables automated communication, scheduled download of data, functionality to send new programs and instructions to the site, and a variety of communication and data collection diagnostic utilities.
2. Server Infrastructure
The GAMUT data workflow is spread across three virtual servers:
- A server running Campbell Scientific’s Loggernet software that manages communication with each site.
- A server running Microsoft SQL Server hosts the operational databases into which the streaming sensor data are loaded.
- A web server on which several applications are hosted for sharing GAMUT data on the Internet.
3. Streaming Data Loading
Data are downloaded as text files from each of the monitoring sites and then the Streaming Data Loader, which is installed on the Loggernet server, is used to load the data into Observations Data Model (ODM) databases (one for each watershed), housed on the Microsoft SQL Server. The Streaming Data Loader and the ODM databases are components of the Consortium of Universities for the Advancement of Hydrologic Science, Inc. (CUAHSI) Hydrologic Information System (HIS) .
4. Operational Databases and Data Quality Assurance
In addition to the field protocols specified in the GAMUT QA/QC Plan (e.g., site visits, calibrations, maintenance, etc.), we have developed automated data checks as stored procedures on the databases. New data are screened for battery voltages below acceptable thresholds, values that are outside acceptable ranges, values that are persistent, etc. When problematic conditions are detected, email alerts notify watershed technicians so that they can investigate.
5. Data Quality Control
ODM Tools Python is an open source software application that enables the watershed technicians to perform quality control edits on the data stored in the ODM database. Features include the export of data series and associated metadata, plotting and summarizing multiple data series, and the recording of quality control edits performed on data series through an integrated Python script editor and console. This important functionality moves raw data to quality controlled products while capturing information about transformations to ensure that the full provenance of the data is recorded. ODM Tools Python is available at https://github.com/UCHIC/ODMToolsPython.
6. Backups
The GAMUT data management workflow contains multiple levels of backups.
- Storage on the datalogger at each monitoring site ensures that if the centralized data management system goes offline, data collection will continue uninterrupted.
- The Loggernet network is backed up regularly using the built-in backup utility.
- The individual text files downloaded from each site are regularly archived ensuring that the original data files will always be available exactly as they were collected.
- The operational SQL Server databases have regular file-based backups.
- Each of the virtual servers on which the system runs are scheduled for backups using the capabilities of the virtualization software ensuring continuity if the physical hardware were to fail.
7. Data Sharing on the Internet
The data stored in the databases are shared on the Internet using multiple mechanisms. The data are published using the CUAHSI HIS WaterOneFlow web services, which can be accessed via web service requests. We developed a web-based interface including the ability to browse available data series, an interactive map, and a variety of plot types and descriptive statistics. The web-based data visualization is found at http://data.iutahepscor.org/tsa/.
8. Equipment Management
We developed a database for storing information on the inventory of data collection equipment (e.g., sensors, dataloggers, etc.), deployments of the equipment, and records of field activities and service events. This database is linked to a web application interface enabling the watershed technicians to enter information about the equipment, where it is deployed, and field activities performed on the equipment. The web application is available via GitHUB: https://github.com/UCHIC/ODM2Sensor/.